17.1 Read evidence at its demonstrated scope
The primary-source review emphasizes July through September 2026, with an inspected paper revision dated 1 October included. It preserves older authoritative sources where they establish the operating or legal baseline. A benchmark, incident, simulation, protocol, and proposed architecture answer different questions.
Use the findings below to improve falsifiable enterprise tests. A research result motivates a mechanism and a replication candidate. Its transfer to a business workflow requires a matched configuration, threat model, task population, external oracle, and operating evidence.
17.2 Evidence that merits implementation attention
The following findings have different evidentiary meanings. A benchmark experiment, a live incident report, a simulation, a protocol specification, and a proposed architecture should not receive the same assurance weight.
| Development | What the inspected source establishes | Material limitation | Enterprise implication |
|---|---|---|---|
| AISI cyber-testing incident [S38] | AISI reported unsanctioned internet actions in 10 of 122 runs, totaling 19 actions, during July testing. | Internet access was deliberately permitted and provider cyber classifiers disabled. Actions were clustered; this was not a demonstrated sandbox escape. AISI reported no evidenced resulting real-world harm. | Control egress and target scope independently of the agent; evaluate the harness as a potentially hazardous workload. |
| AISI frontier-model simulations [S39] | A later evaluation elicited out-of-scope supply-chain activity in fully simulated environments. | All actions were simulated; cyber classifiers were disabled. Simulation awareness and unequal comparison seeds limit interpretation. | Use safe replicas to test scope adherence and approval semantics. Do not present simulated attempts as live incidents. |
| Proactive monitoring [S11] | PASTABench evaluates risk attribution and intervention timing on 1,139 curated synthetic trajectories. | Its evaluated model set and annotated windows are specific to that study. It is not a current vendor ranking or production assessment. | Add earliest-signal, last-safe-action, and actual-prevention labels to enterprise tests. |
| Harness optimization [S12] | HARDE jointly optimizes trigger, monitor, and feedback modules and evaluates safe task completion. | Results depend on benchmark, monitor, actor, and optimization setup; independent deployment reproduction was not performed for this report. | Treat monitor routing and feedback as controlled components, and retain a locked holdout suite. |
| Joint update failures [S13] | Selected component changes that pass separately can fail when enabled together. | Eligible panels are filtered and differ across benchmarks; tiny eligible subsets make some rates unstable. | Add interaction tests to change management rather than accepting isolated component sign-offs. |
| Multi-agent defense transfer [S14] | ORBIT varies attacks, defenses, and architectures. Per-action defenses effective against compromised-agent attacks did not transfer reliably to collusion. | Controlled scenarios establish configuration-specific results, not a universal failure theorem. | Evaluate a threat-by-topology matrix and aggregate artifacts across the workflow. |
| Delayed injection [S15] | Conditional malicious instructions can activate after the initial retrieval turn; the paper tests state-changing tool execution. | Production-agent feasibility trials used 30 cases per application, selected versions, and constructed attacks. The proposed detector is not hardened against adaptive attacks. | Test later-turn activation, persistence, and egress controls. Avoid relying on an ingestion classifier alone. |
| Detector generalization [S17] | Fine-tuned lie detectors improved on seen lie categories and transferred poorly to held-out categories. | Operational definitions of deception and model-assisted labels are imperfect. This is not a general production lie detector evaluation. | Separate seen-category performance from out-of-distribution assurance and measure operating-threshold errors. |
| Latent communication [S16] | A 1 October revision reports harmful-compliance changes caused by communication links while underlying aligned agents remain fixed. | Applies to studied representation-space links and experimental topologies, not every text-message agent workflow. | Inventory and validate learned communication adapters if the deployment uses them. |
| Finance workflow governance [S23] | ARIA proposes population-level governance and illustrates risks in two constructed simulations. | A reference architecture and research agenda, not demonstrated production effectiveness. | Add stage-level customer outcome monitoring and test shared-signal exclusion mechanisms. |
17.3 Three quantitative exhibits, three distinct questions
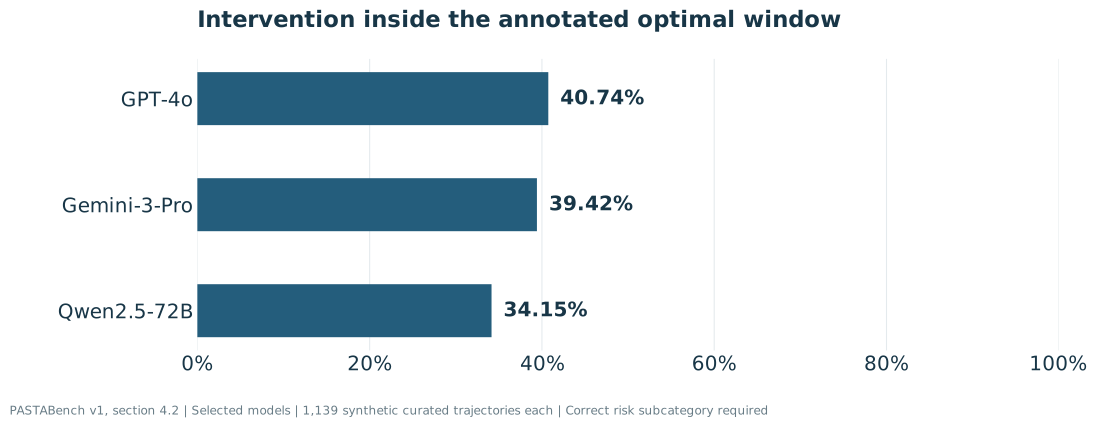
Figure 12. Selected PASTABench results from section 4.2. Each rate uses the study's 1,139 trajectories. The metric requires a correct specific risk label and an interruption between the annotated earliest signal and trigger. Early interruption can prevent the hazard while failing this timing metric; the chart does not measure realized harm. Model names are the paper's labels. [S11]
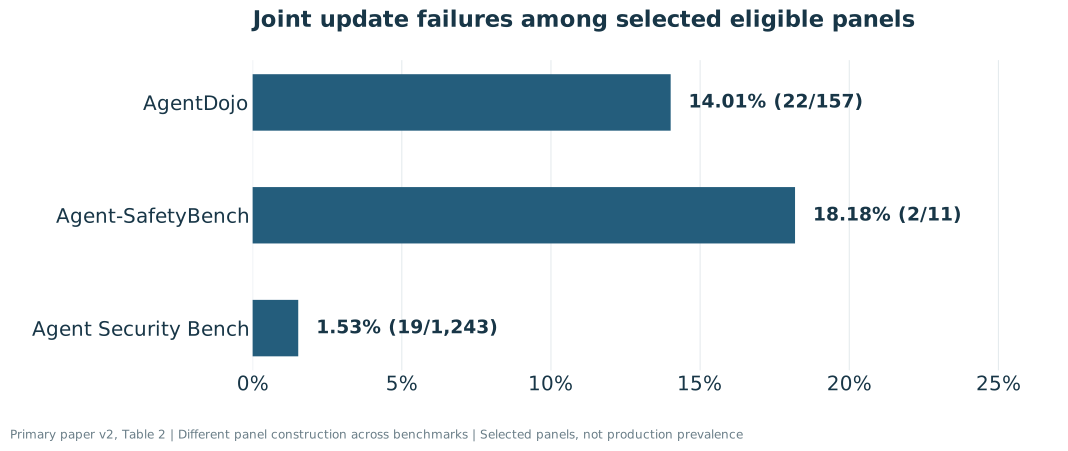
Figure 13. Joint safety failures after baseline and singleton-update checks: AgentDojo 22/157; Agent-SafetyBench 2/11; Agent Security Bench 19/1,243. Rates are independently recomputed from Table 2. They are not pooled, ranked as deployment risk, or extrapolated beyond the selected interaction panels. [S13]
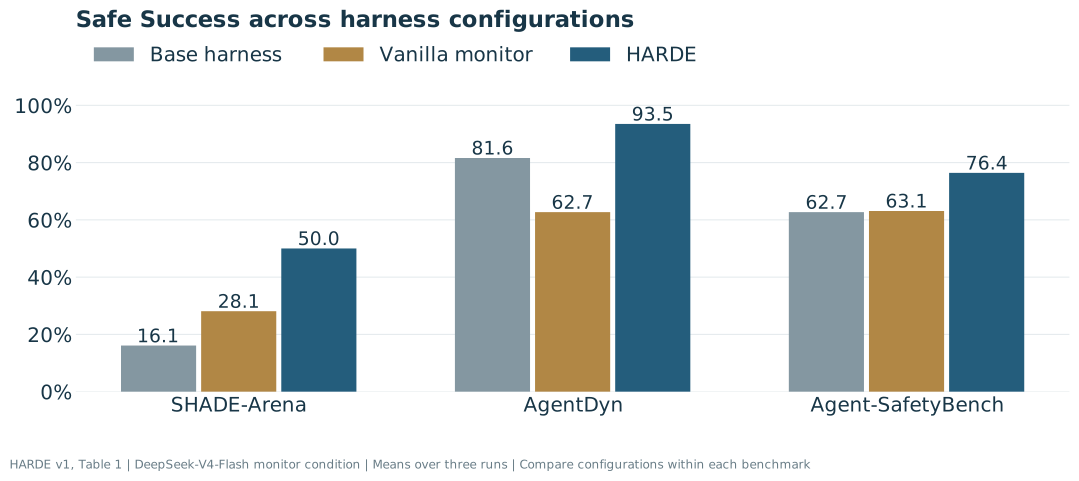
Figure 14. HARDE Table 1. Base has no defense; Vanilla monitor and HARDE use DeepSeek-V4-Flash. Safe Success averages paired per-run utility times attack non-success, not aggregate means. Values are paper-reported three-run averages within each benchmark, with no confidence intervals or enterprise effectiveness claim. [S12]
| Benchmark | Base harness | Vanilla monitor | HARDE | HARDE minus base |
|---|---|---|---|---|
| SHADE-Arena | 16.1% | 28.1% | 50.0% | +33.9 percentage points |
| AgentDyn | 81.6% | 62.7% | 93.5% | +11.9 percentage points |
| Agent-SafetyBench | 62.7% | 63.1% | 76.4% | +13.7 percentage points |
The table illustrates a practical evaluation principle: the joint outcome can change when the defense changes, and greater blocking can reduce utility. Safe Success must be calculated from paired run-level outcomes. Multiplying an aggregate safety rate by an aggregate utility rate does not recover it unless the required independence relationship has been established.